Car dash for your Claude usage
A live dashboard for Claude Code usage limits, built like a car instrument cluster.

Context
I work in Claude every day and the usage limits are real. They stop you mid task, and there is nowhere in the product you can look to see one coming. If you go looking anyway you get a percentage.
A percentage does not tell you much. It will not tell you how fast you are burning the window, what pace would actually get you to the reset, which of your limits is going to run out first, or how long you have got. As a user it is difficult to plan how to best spend your tokens, so you end up an hour into something good with a five hour window running out underneath you. I wanted to fix the visibility and the advice at the same time, and to take it the whole way myself, idea through shipped product.
My Role
All of it. Concept, research, data analysis, design, UI, motion, copy, onboarding, the local helper on npm, the test suite, the audits, QA and the deploy. Solo, no handoff at any point.
I built it with Claude, Claude Code, Claude Design and ChatGPT, and that is the other thing the project is meant to show. This is what an end to end process looks like when one designer runs it with AI instead of through a team.
Discovery & Research
Why a dashboard
Because the metaphor does work, and I checked before I committed to it. I spent an evening going through modern clusters from Porsche, Mercedes, Polestar and Audi, and two things came out of it worth stealing.
The good ones give you relative information rather than absolute. Showing 68 mph matters less than showing you are three over the limit. So the headline number in mine is "56 minutes at this pace" rather than "62% used", because the first one is something you can act on and the second one is trivia.
The second thing was about glancing. A cluster is useful because you notice things without looking straight at them, which means signalling with shape and position instead of text. That is why this is instruments and not a table, and why nobody has to be taught what a warning lamp or a redline means.
The data was the hard part
Most of the work went here, and guessing instead of measuring would have sunk the whole thing. I parsed 7.2 MB of my own session files before I designed anything against them.
You cannot read those files straight, because Claude Code writes each response several times over. In my sample 442 records collapsed to 270 real ones, and one of them had been written four times. If you add up every line you overstate cache reads by 1.59x and output by 2.06x, so everything in the product dedupes before it counts anything.
Then I measured how much of elapsed time the data source can actually observe, and it was 3.4%. One stretch of 112 minutes burned 37% of a five hour window while the source saw nothing at all. The blindness is not random either, it tracks exactly whether you are working, so you cannot average it away.
That took out the obvious version of this product, because you cannot smoothly animate a fuel gauge off a source that is dark 96% of the time. I would rather show someone an honest gap than a smooth animation that is making things up.
What I Built
A car instrument cluster. Your two limits are fuel tanks. Burn rate is the speedometer, and the redline is computed rather than decorative, so it sits at whatever pace would drain the tank before your next reset. Context is the temperature gauge, and it runs hot right before Claude Code compacts your session.
The big number in the middle is the thing most people are actually after, which is how long you have got at this pace and which limit is going to stop you first.
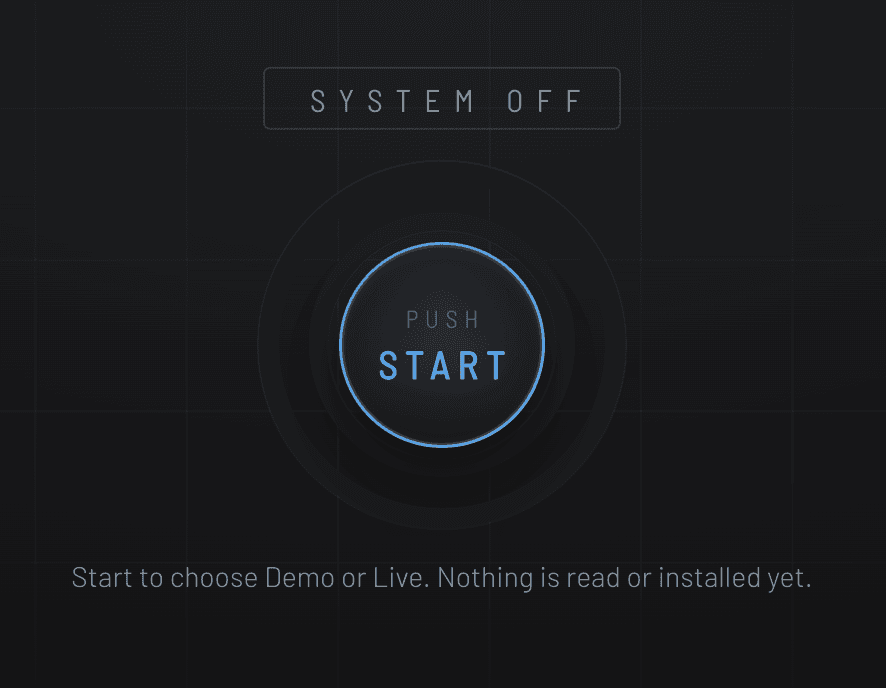
Two ways in, and you can take either one right now at nateheld.com/claude-dash. Demo needs no setup and runs anywhere. Live is one command and shows your real numbers. No backend, no account, nothing uploaded.
Responsive
This is a desktop product (for now!) The data lives on the machine running Claude Code, and that happens primarily on desktop. But responsive was still very important as to be usable when the windows width is shortened to use next to Claude.
So above 780 the composition scales as a unit, and below that it stops scaling and reflows into a single column, because past a point shrinking a dashboard just gives you an unreadable dashboard. Labels degrade on a ladder rather than getting trimmed.
What Was Hard
The hardest part was owning the whole thing end to end, and the speed bumps that come with that. Halfway in I hit a blocker I thought had killed the live version of the product, and I pivoted to other in-product solutions before I found a way back to what I wanted in the first place.
Here is what actually happened. There is a first party usage endpoint that returns your real limits on demand, in about 200 milliseconds, costing zero tokens. I had ruled it out early, because reaching it needs your sign in and my hard rule was that this never touches credentials.
What I had missed is that I was treating two different things as one. The rule I actually cared about is that the web page never touches credentials, and that rule exists for reasons specific to web pages. A page is untrusted by default, it runs whatever it is served, and you cannot inspect it before it executes. None of that describes a program you install yourself and can read first.
So I split the rule. A small helper on your machine reads the sign in that Claude Code already saved there, in process, and it never logs it or serves it. What reaches the browser is percentages and reset times with nothing else attached.
That cleared the roadblocks all at once. Any browser, no folder picker, nothing written to your settings, no restart. It polls on a schedule instead of waiting for you to type, and because it reads the limiter directly it counts your usage everywhere, including claude.ai and your phone.
It did cost me a way in. There had been a third route, where you dropped in a folder of past sessions, and it was carrying real weight while live was still uncertain. Once live worked I had three overlapping promises where two would do, and the first thirty seconds is where people decide whether this is for them, so I cut it for the experience rather than because it was useless.
Demo stayed, and it is not a mockup. It is a generated five and a half hour session running through the same code as live data, with a scrubber you can drag through a cache miss, a hot context window and a reset. The generator knows the true conversion rate, so any drift between that and the recovered one is a bug, and it has caught real ones.
Designing around what you don't know
Fresh numbers are not the same as certain numbers. A helper can be stopped, a sign in expires, the endpoint rate limits you, and for anyone not running a helper the 3.4% problem is exactly what it always was.
So when the data goes dark the tanks stop estimating. They become outlines holding the last real reading as a floor, labelled UNREAD, and the panel tells you why. When work is happening that it can see but cannot quantify, it says UNMEASURED and counts the turns instead. Before there is enough movement to compute an honest pace the speedometer reads MEASURING PACE, because I would rather tell you I am still measuring than hand you a zero you might believe.
What Happened
How I worked
The build became the source of truth early on, and after that design decisions happened in the browser against real numbers rather than in a static frame.
I audited it three ways and each one found different things. A correctness pass run as TDD turned up a real security hole, where the helper's permissive CORS setting would have let any website open in any browser read every Claude conversation on the machine while it ran. An outside UX audit, which I deliberately ran through a different vendor's model so the reviewer had no stake in the architecture I had already committed to, gave me eight recommendations and lost three that I overruled with the reasons written down. A post ship audit of the live product produced a list I am still working through.
Underneath all three there is a real test suite running the actual code, because a wrong denominator or a flipped threshold looks completely fine in a screenshot.
What shipped
A live product on its own domain, with a published package underneath it.
The page: one file, 3,775 lines, no dependencies, no external requests
The helper: 598 lines, no dependencies, published to npm
Tests: 251 on the page, 27 on the helper
Tokens this project consumed: 1.68 billion (and usage consuming!)
Concept, research, data analysis, design, UI, motion, copy, onboarding, the helper on npm, the tests, the audits, QA and the deploy, all mine, using Claude, Claude Code, Claude Design and ChatGPT.

Claude Code Workflow

Designing / Building / Testing / Improving
Push Start
Car themed from the start / Calculated design